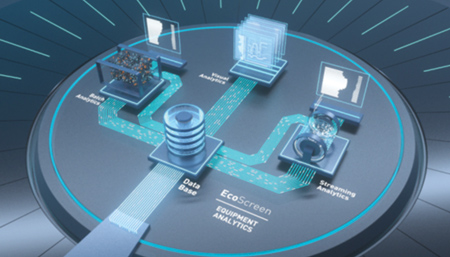
EcoScreen Equipment Analytics is the latest product from Dürr's Digital Factory. The software continuously collects and analyzes data from the paint shop, making painting processes transparent and efficient.
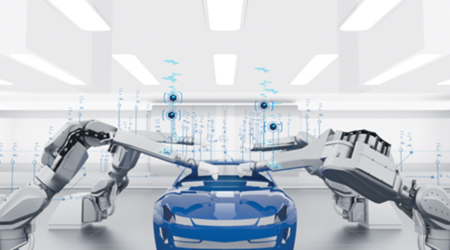
Paint robots equipped with sensors enable the acquisition of large amounts of data - an important driver for applications in the IIoT.
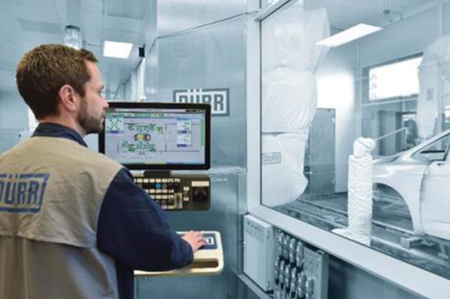
With the new Equipment Analytics software, the plant operator can monitor the condition in the painting cell.
Dürr EcoScreen Equipment Analytics is engineered to bring transparency and intelligence to paint shop processes. The newly developed solution for the Industrial Internet of Things (IIoT) evaluates all robot and process data, traceable down to the millisecond, so that faults can be quickly identified and rectified. The technological highlight is a streaming analytics application for real-time data analysis.
What is happening in the painting cell and what is the condition of the technology? EcoScreen Equipment Analytics can provide the answers. The software records and analyzes all relevant signals from the sensors and actuators integrated in Dürr painting robots. The application technology of the front robot arm, for example, provides data on the pressure regulators, metering pumps and color valves. Main needles, turbine speed, shaping air and air heaters from the electrostatic rotary atomizers are also connected to the data recorder. The software records the positions, torques and temperatures of the painting and handling robots' individual axes. Data from the conveyor technology is collected for the positions of the bodies in the painting booth. This information is compared with data from the painting cells, such as start and end time of painting, or production data for individual bodies such as type and color code. All errors and warnings from the painting process are collected.
Visual Representation Creates Transparency
In addition to the data recorder and database, the IIoT solution comprises a visualization for the graphical representation and analysis of the results. "With the help of the Visual Analytics module we can precisely trace the data from the previous weeks with millisecond accuracy," explained Dürr Systems AG President and CEO Dr. Lars Friedrich. "The detailed information helps to identify and eliminate faults quickly. The cross comparisons of different robots improve root cause analyses and help the plant operator boost plant availability, increase the first-run rate, and improve the overall process sequence." This creates transparency. For example, the signals collected from the metering pump together with flow rates, pressure regulators and main needles of the atomizers can be displayed simultaneously on the control computer and correlations can be defined. The software can display these process signals in a 3D view together with the trajectories traveled by the robots and the exact position of the body and perform a comparison. By superimposing the signal curves, EcoScreen Equipment Analytics can compare bodies by type and color.
Algorithms Calculate the Ideal Plant Condition and Show Anomalies
The Streaming Analytics module goes one step further: it analyzes the data in real time. Using algorithms, it calculates patterns and correlations that describe the ideal plant condition from the data collected. Even the smallest anomalies within the plant and in the processes are identified. Employees can initiate corresponding service measures right away and get to the bottom of the deviation before the body leaves the paint booth. EcoScreen Equipment Analytics uses software from the IIoT platform ADAMOS for the streaming analytics function. Dürr operates ADAMOS together with Software AG and several mechanical engineering companies.
Model-Based Plant Monitoring
Streaming Analytics provides the plant operator with easy-to-use graphical interfaces that do not require any programming expertise to create analysis models. For this intuitive functionality Dürr developed a Model Editor that provides the user with a library of analysis modules. These can also be combined into new models.
For example, the painting pressure data monitored during the application is displayed graphically on the screen. The operator can see that all values are within tolerance and with Streaming Analytics, he can create an analysis model that automatically determines anomalies such as air bubbles in the paint from the characteristics of the signal curve. These possible applications make the Streaming Analytics solution a powerful tool because the software automates the plant operators' process knowledge using online analyses.
Integration of Machine Learning in the Future
"In parallel with Streaming Analytics, Dürr is developing other modules for batch analytics applications that work on the basis of artificial neural networks. The software learns the optimal process condition automatically and registers every deviation. This means that the software will solve problems through machine learning," explained Dr. Friedrich. "If the self-learning modules detect trends, problems in the equipment can be identified in advance by specifying a forecast of the event time."
A number of car manufacturers have been using the EcoScreen Equipment Analytics software since 2018. The additional module Streaming Analytics based on real-time data has been used for the first time in a complete production line since the fourth quarter of 2018. The Batch Analytics module, which uses artificial intelligence, is currently in the trial phase with a customer.
For more information contact:
Dürr Systems, Inc.
26801 Northwestern Highway
Southfield, MI 48033
248-450-2000
www.durr.com