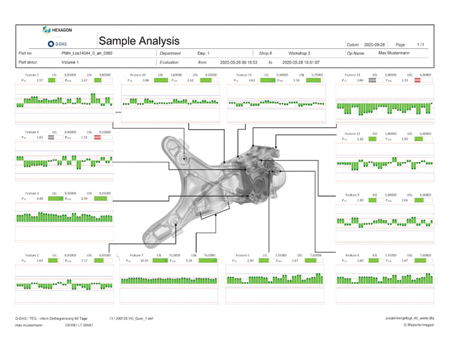
Volume Graphics software transfers not only the measured values, but also an image of the CT-scanned component (in this case a cast part) into the Q-DAS qs-STAT statistics software package. This enables the dimensions to be clearly linked to the corresponding detail in the report. Visual support makes it easy for users to identify critical processes quickly, as well as weak points and deviations; green bars show time-series of measured values for specific features of the object. Summary graphics like those shown here are an essential tool for the definition of corrective actions needed to optimize a manufacturing process.
Volume Graphics is now extending data export from its non-destructive testing and analysis software based on industrial computed tomography (CT) to the statistics software Q-DAS qs-STAT. "This close cooperation between Volume Graphics and Q-DAS, which are now united under the roof of Hexagon, takes automation to the next level: statistical evaluations can now be fully integrated into a CT scan data analysis workflow," said a spokesperson.
"Many users want to statistically analyze the quality data of their scanned components," continued the spokesperson. "This is often a basic requirement for automated applications. Q-DAS solutions, such as the Q-DAS qs-STAT package, are considered to be the de facto standard for statistical analysis. Volume Graphics had already implemented an option for data export to the Q-DAS software in the earlier Release 3.3 of VGSTUDIO MAX. But now, as an integral part of Hexagon Manufacturing Intelligence, Volume Graphics and Q-DAS are working on making the data exchange between computed tomography and statistics even tighter."
A first result of this collaboration is the option to also export 3D representations of components or measured features to Q-DAS software. This option was recently introduced with version 3.4.3 of VGSTUDIO MAX, VGMETROLOGY and VGinLINE. In practice, the user simply marks the relevant box in the export mask. The software then adds the corresponding part image to the data to be exported. Users can make their reports, which they define and access with Q-DAS qs-STAT, even more transparent. They can immediately see which measurement series belongs to which detail.
"Currently, it is possible to export 3D component representations from our coordinate measuring module using measurement data," said Johannes Knopp, Product Manager Automation & Inline at Volume Graphics. "But progress does not stop there. Our development department is already working on including additional results from the array of gray-value-based material analyses, such as defect analyses, in the export functions. The aim is to realize a seamless, fully automated workflow for all CT quality data."
For more information contact:
Volume Graphics, Inc.
4944 Parkway Plaza Blvd.
Suite 110
Charlotte, NC 28217
704-248-7736
sales-us@volumegraphics.com
www.volumegraphics.com